Introduction
The Chrome DevTools are a set of developer-focused utilities and debugging tools built into Google Chrome. They can be used to check website sources, run scripts, monitor network requests, and optimise the performance of your web application. In this article, we are discussing 10 very useful Chrome DevTools features that can make your life as a developer easier.
1. Unminify JavaScript code to read and debug
Code minifying is a build technique that is used to decrease the size of code files by removing indentations, spaces, and various other unnecessary things. Browsers can easily read and execute a minified file but for developers, reading a minified file is almost impossible.
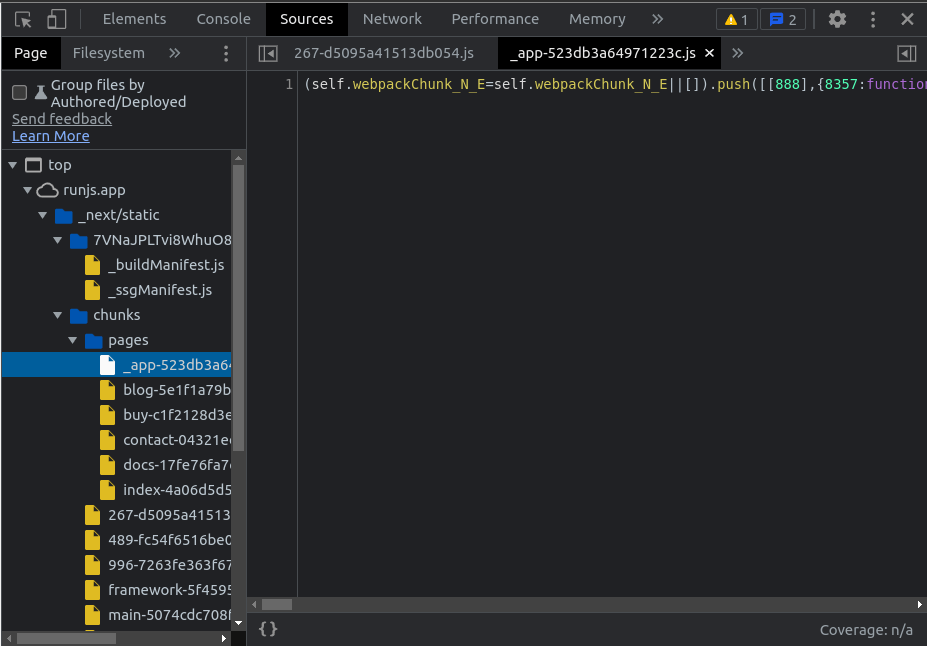
Using Chrome DevTools, you can easily unminify a JavaScript file. Open the Chrome DevTools and go to the source tab. Then open a minified file from the left file explorer tab. Now click on the {} icon on the bottom of the file editor to unminify a file.
2. Record and replay user flows
As a developer, you want to test how your website will react to different user flows. User flows are the journeys that users take on your website. It can be challenging to test a user flow manually, as you may need to repeat the same action again and again to mimic the user.
Instead, you can use Chrome DevTools to record user flows and replay as needed. This single trick can save a lot of time in optimising your code for different user flows. You can also measure the key metrics of your interest by replaying the user flow.
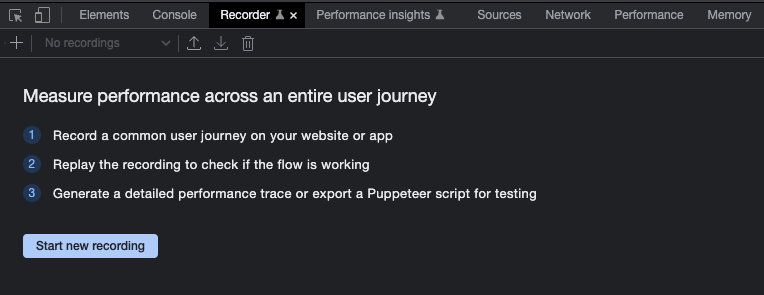
To record a user flow, open the Chrome DevTools and switch to the recorder tab. Now click on the red coloured recording button to start a new recording. Give your recording a unique name so that you can recognise it later.
Now press the record button and perform the user flow that you want to record. All your actions, such as clicking buttons and navigating to other pages will be recorded.
Once you've finished, click the end recording button, and your user flow is ready to replay. Now you can test your website with this flow automatically, without manual repetition.
3. Emulate mobile devices
A lot of people use their smartphones to access the internet. Due to increasing numbers of mobile users, developers typically adopt a mobile-first approach for UI development.
Smartphones come in various shapes and sizes. For a developer, it's almost impossible to buy every device of various screen resolutions to test their web applications.
Instead, you can use the Chrome DevTools to emulate various device sizes, including iPhones, iPads, Samsung Galaxy phones etc. If you are not happy with the fixed screen resolution, you can also have a variable resolution option in the device dropdown menu.
In addition to all those features, you can emulate CPU throttling in the smartphone to test how your website behaves for an old device with lower processing power.
To access the device emulator, open the Chrome DevTools and click on the mobile icon on the left side. You can select a variety of devices from the device dropdown menu.
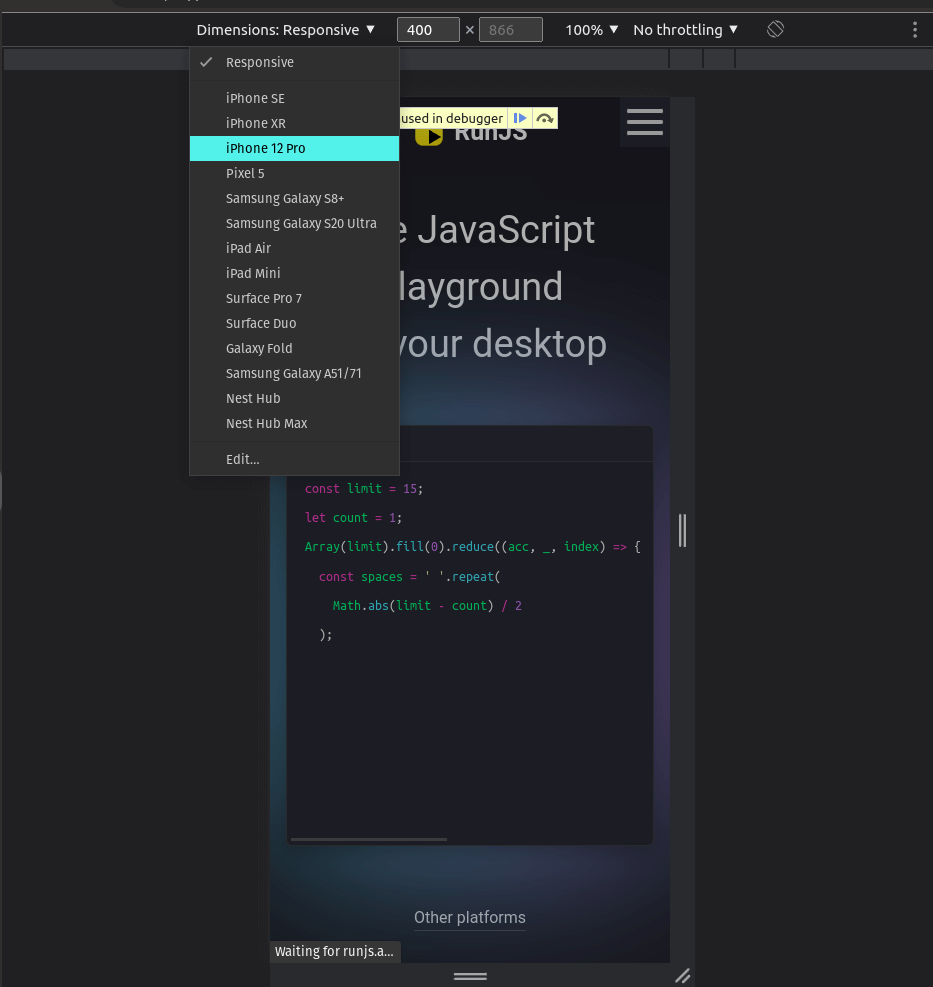
Now you can select the device of your choice and tweak the device configurations to test your website in the condition of your choosing.
4. Manage client-side storage
Websites can store client-specific data in your browser. Every website has its own client-side storage scope and can't see data from other websites.
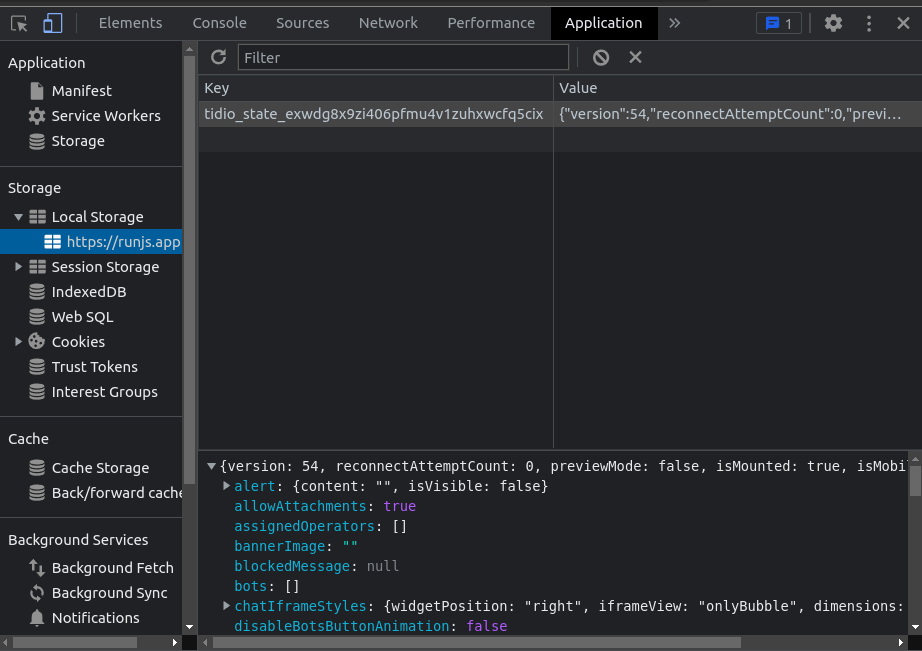
To view this client-side storage, switch to the application tab of your DevTools. Inside the local storage section, you can see the URL of the websites that store data in your browser.
If you click one of them, you can see some key-value pairs. This is the data that the websites save in your browser for future reference.
You can update or modify the data by double-clicking on the key or value section. You can also select the key-value pair with a single click on a row. Then right-click to get the edit option in the context menu.
You can add a new key-value pair by double-clicking on the empty section. Here I am adding the custom-data key in the local storage.
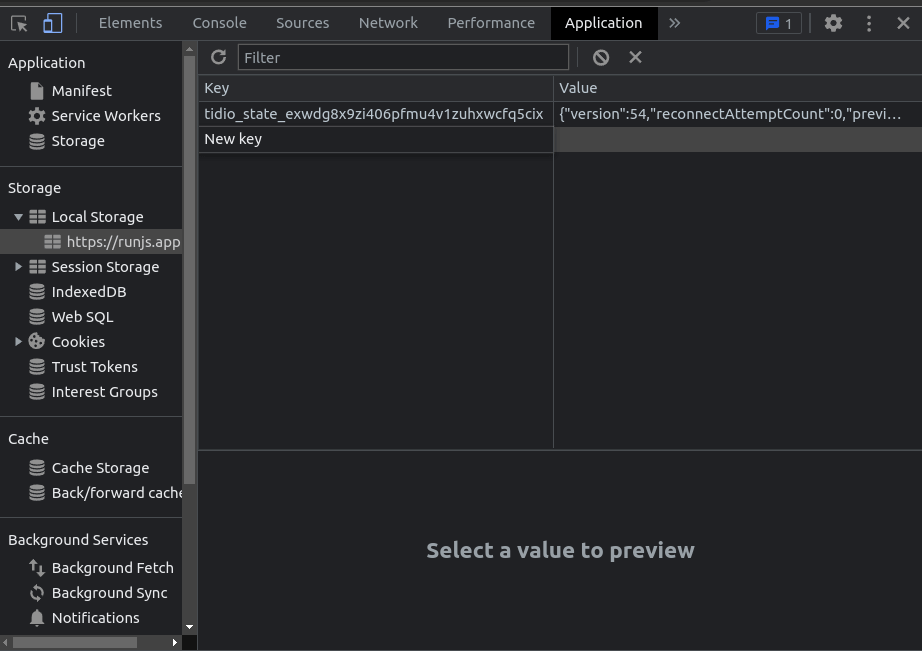
To delete a key-value pair, click on the row to select it. Then hit the delete button to delete the key-value pair.
You can store client-specific data within your website by using the browser's localStorage API. To set a new key-value pair, use localStorage.setItem method.
localStorage.setItem("myCat", "Tom");To get value, use the key of that object.
const cat = localStorage.getItem("myCat");5. Enable local file overrides
Making changes to a production website is not ideal. If you break something, the whole website can go down. Is there a safe option to try out new things without actually changing the production code?
Local file overrides are a convenient feature for making tweaks to your website without changing the actual source code. Using local file overrides, you instruct Chrome to use your local modified files rather than using the files coming from the server.
To enable local file overrides, go to the sources tab of your Chrome DevTools and click on "enable local overrides". Now create a directory and give Chrome permission to save all the overrides in that directory.
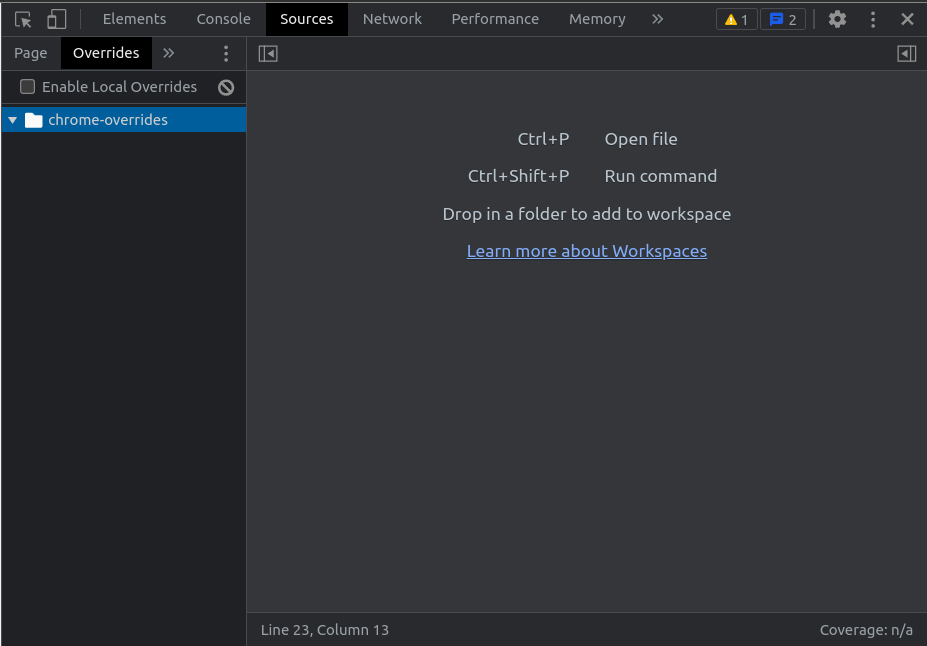
Go to the network tab and select any file you want to override, and click on the save for override option. Now, this file will be visible inside the override tab of your sources. Edit this file with the changes you want, and when you reload the tab, Chrome will use your local modified version rather than the files from the server.
6. Re-run http requests
You can see all the network requests a site makes by visiting the network tab of Chrome DevTools. Clicking on any of these requests will show you more details, such as the request headers and responses etc.
You can copy each of these requests and re-run them from other environments. This technique can be useful for modifying or debugging requests.
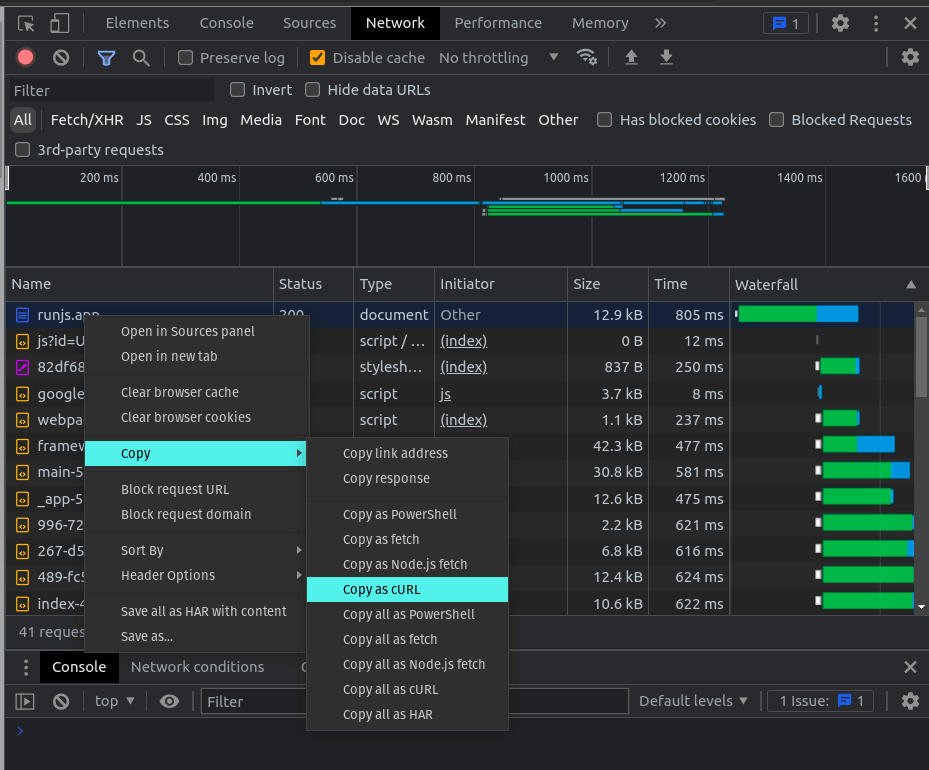
To copy a request, right-click on the selected request to open the context menu and hover on the copy option. You can see a list of options to copy this request. A popular option is to copy as cURL. You can also copy it as a fetch to use in your JavaScript code.
You can now paste the copied cURL request into a terminal and re-run the request. If you don't have curl installed, you can visit curl official website for an installation guide.
7. Filter network requests
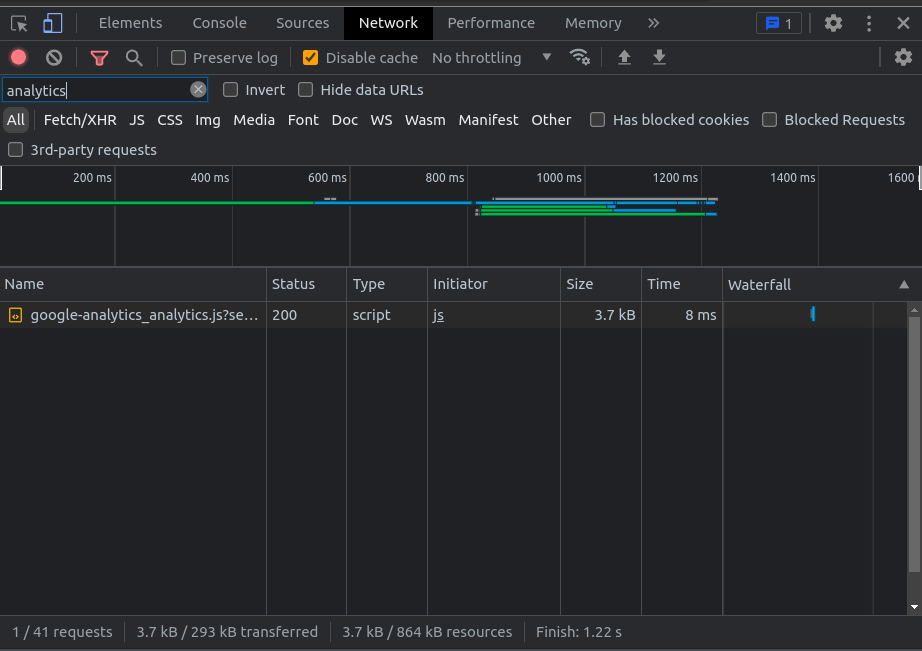
Chrome DevTools makes filtering network requests very easy. Go to the network tab to see all the network requests made by the website. Now click on the funnel icon to reveal the filter options to filter the network request.
You can filter the network requests using matching text in the filter input. If you type "analytics", for example, only the requests that contain the word "analytics" come up. You can also use regular expressions to find your desired requests.
You can exclude requests from the searches by clicking on the invert checkbox beside the text field. For example, if you want to exclude all the JavaScript requests, put js in the text field and click on the invert option. All the JavaScript files will be excluded from the list.
You can also filter network requests using resource type. If you want to get the HTML document, click on the Doc resource type. All the requests that fetch HTML will show up.
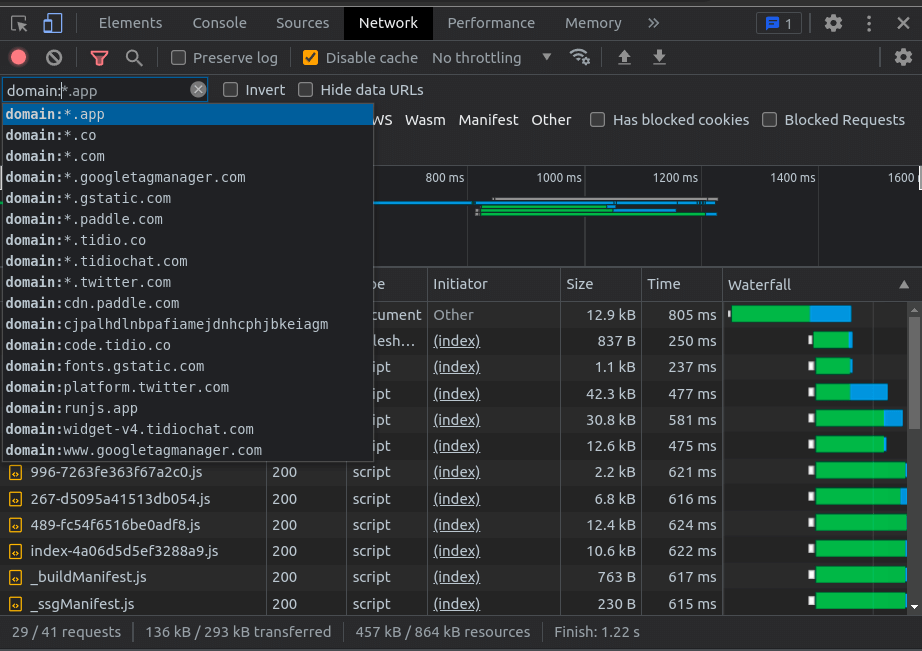
To filter network requests based on the domain name, put domain: followed by the domain name into the filter input. This will cause just the requests to the matching domain to appear.
8. Throttle network speed
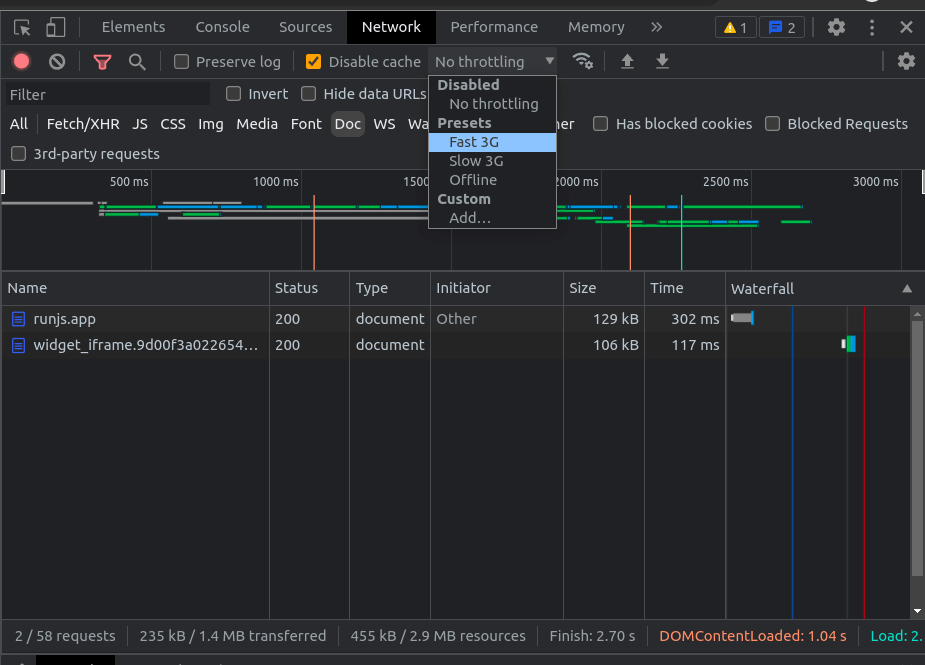
To check how your website performs under various network conditions, you can use the Chrome DevTools to throttle the network speed. From the network tab, you have four throttling options by default. No throttling, fast 3G, slow 3G, and offline. You can choose all of them one by one to test and compare the performance of your website and optimise it for slow network speeds.
If you are building a PWA (progressive web application), you can test the offline behaviour of your app by selecting the offline network option.
9. Find unused JavaScript
You can find unused JavaScript on your website by using the coverage tab in the Chrome DevTools. Press Ctrl/Cmd+Shift+p to open a command menu and type coverage to open the coverage tab.
Now, click on the reload button within the coverage tab. The coverage tab tracks all the files and prepares a coverage list for you. Inside the list, you can see all the files have a usage visualisation graph. Click on a row to see the unused code in the sources tab.
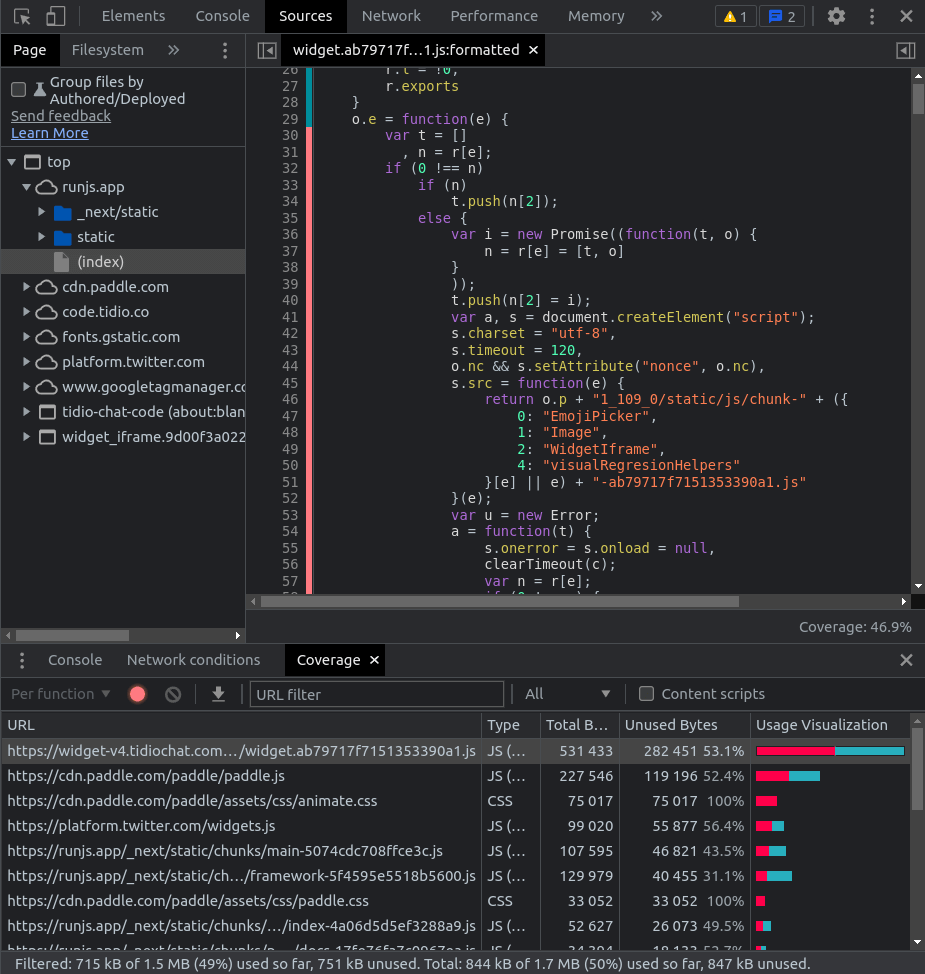
You can select JavaScript or CSS by clicking on the All dropdown menu next to the URL filter text input. Open a file inside the source tab by clicking on the row. The red colour borders indicate unused code. You can remove unused code to improve the performance of your website.
10. Set breakpoints
A Breakpoint is a point in your code where the debugger stops the execution of code. To set breakpoints in your code, switch to the sources tab of the Chrome DevTools. There, from the left side, select a JavaScript file. If the file is minified, you can unminify it by clicking the {} symbol at the bottom. To set a breakpoint, click on the line number of the code. You can find a list of breakpoints in the breakpoints section in the right side pane.
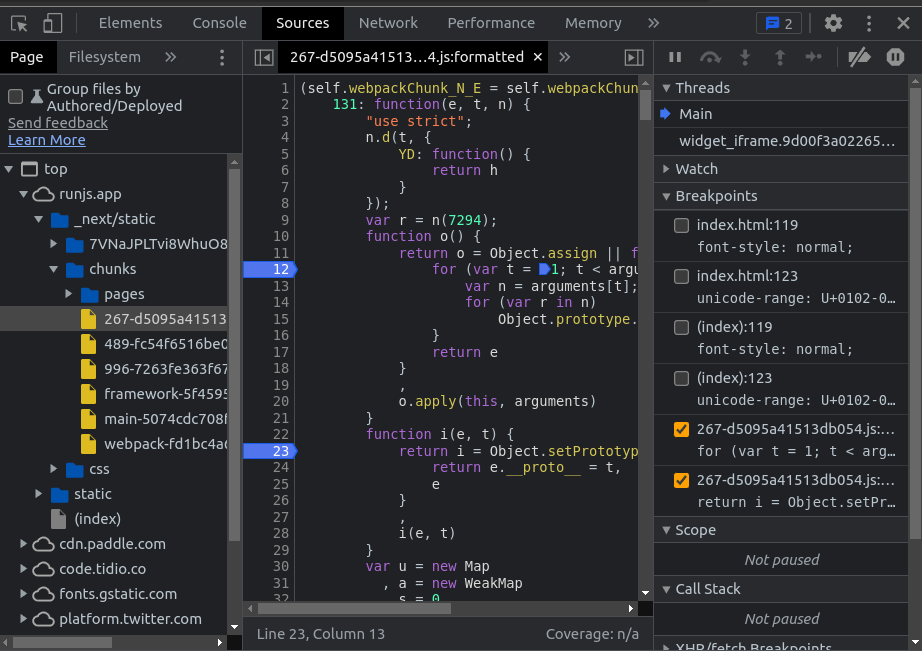
Now reload the page to see the breakpoints in action. The code execution pauses at your first breakpoint. At this point, you can analyse various parameters of the code. Click on the debugger buttons to go forward and backwards to find the bug you are looking for.
You can also pause the code execution by placing the debugger keywords within your JavaScript code.
function greetings(name) {  let phrase = `Good morning, ${name}!`;
  debugger; // <-- the debugger stops here
  console.log(phrase);}
Conclusion
In this guide, we have looked at some of the most useful features that the Chrome DevTools have for web development. If you'd like to go further and learn more about these tools, check out the official docs.
DevTools are an incredibly powerful tool that can help make web development faster, easier and more enjoyable. We hope this guide has been helpful in showing you some of the many things that DevTools can do. Happy coding!