Version 4 is a new major release for RunJS and with it comes a significant number of improvements, enhancements and new features. This release adds a new status bar, dedicated runtime environments, a web view, logpoints, and a much improved output panel.
Runtime environments
You can now choose how each tab runs your code. The default Browser & Node.js environment behaves as before, giving you access to both browser and Node.js APIs in the same context. You can also switch a tab to a dedicated Node.js environment - useful for server-side scripts where you want to make sure your code isn't accidentally relying on browser globals - or a dedicated Browser environment for code that should only use web APIs.
This also paves the way for potentially supporting more runtime environments in the future.
Web view
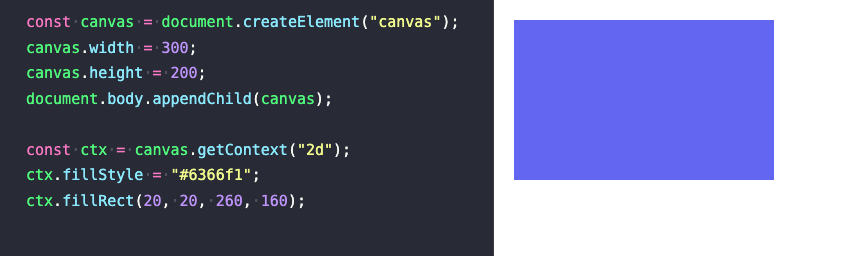
Browser-enabled environments now include an optional web view, which renders in the output panel. It's handy for working with the canvas, prototyping React components, or anything else that benefits from a live DOM next to your code.
The web view runs in the same context as your script, so anything you append to document.body, mount with React, or draw onto a canvas appears immediately as you type - no separate browser window, no HTML boilerplate, no dev server. It's a great fit for:
- Prototyping UI components. Import React (or any framework) and render straight into the panel. Tweak props, state, or styles and see the result update live.
- Canvas and WebGL experiments. Sketch out animations, generative art, or game loops with
requestAnimationFrameand watch them run alongside the source. - DOM and CSS exploration. Try out a layout idea, test a selector, or experiment with a Web API like
IntersectionObserverwithout spinning up a project. - Working with SVG, charts, or data visualisations. See the rendered output update as you change the underlying data.
The web view can be toggled on or off per tab from the status bar, so it stays out of the way when you don't need it.
Status bar
A new status bar at the bottom of the app brings these controls together. From here you can switch runtime environment, toggle the web view, and change the language of the current tab between TypeScript, JavaScript, TSX, and JSX.
If you'd rather not see it, the status bar can be hidden from the settings.

Logpoints
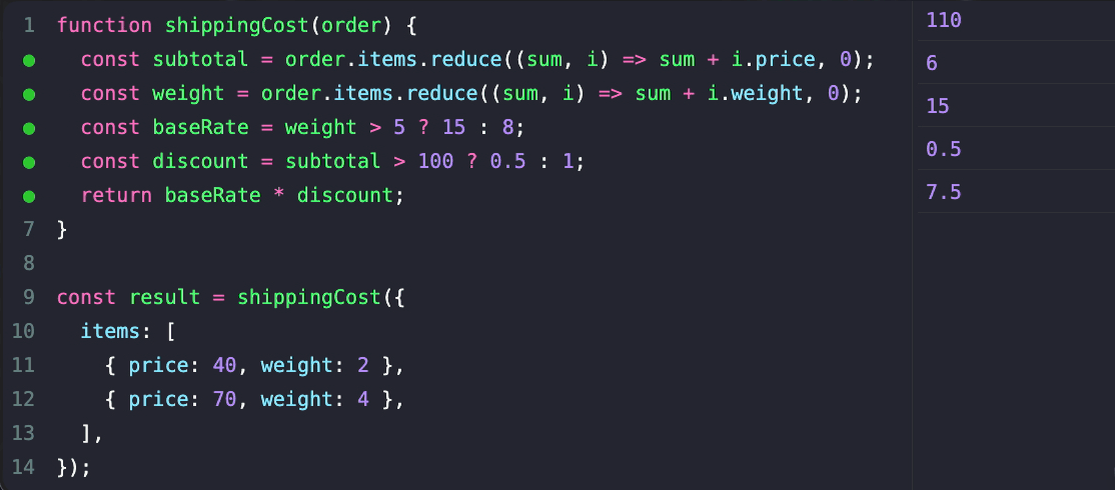
Logpoints are a new way to inspect your code without modifying it. Click the gutter next to any line to add a log point, and RunJS will surface the value of that line in the output panel. Unlike auto-logging, logpoints work inside function bodies, variable declarations, and other places where results would otherwise be invisible - giving you quick insight into what your code is actually doing, with no console.log clutter to clean up afterwards.
Logpoints are especially useful for:
- Peeking inside loops and callbacks. Drop a log point on a line inside a
.map,.filter, orforloop to see every value as it flows through, without wrapping the body in braces or adding a temporaryconsole.log. - Inspecting intermediate values. When you have a long expression or a chain of method calls, a log point on any line shows you what that step evaluated to - handy when a transformation isn't producing what you expected.
- Watching variable declarations. Logpoints work on
constandletdeclarations inside functions, so you can see the assigned value without restructuring the code. - Debugging without side effects. Because logpoints live outside your source, you can add and remove them freely while iterating, and they'll never end up committed to a file by accident.
For example, given this snippet:
const numbers = [1, 2, 3, 4, 5];
const doubled = numbers.map((n) => {  const result = n * 2;  return result;});
Adding a log point to the const result = n * 2 line will surface each value (2, 4, 6, 8, 10) in the output panel as the .map runs - without changing a single character of the code.
Rebuilt output panel
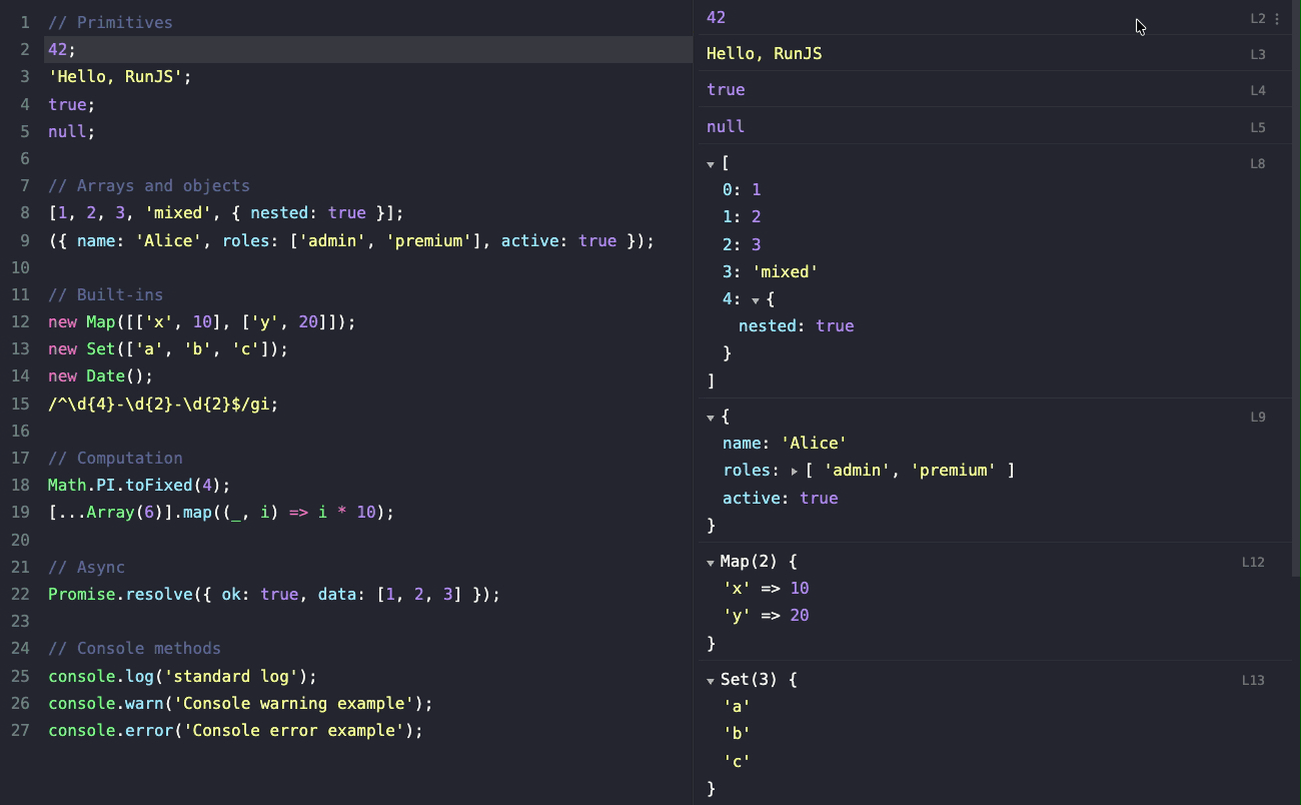
The output panel has been rebuilt from the ground up. It's significantly more performant, especially with large result sets, and each result now shows the line number it originated from. Hovering over a result highlights the corresponding line in the editor, making it much easier to connect output back to the code that produced it.
Everything else
- Upgraded Node.js to version 24.14.1.
- Upgraded Chromium to version 146.
- Upgraded V8 to version 14.6.
- Settings options have been reorganised and a new Editor tab has been added.
- Added a new shortcut to show lint error tooltips:
Cmd+F1on macOS,Ctrl+F1on Windows and Linux. - Added a new shortcut to show hover info tooltips:
F1on all platforms. - Fixed an issue where AI chat could produce blank responses.
As always, please feel free to get in touch, report bugs and suggest new features. You can also join the conversation on Discord or open an issue on GitHub.