Output
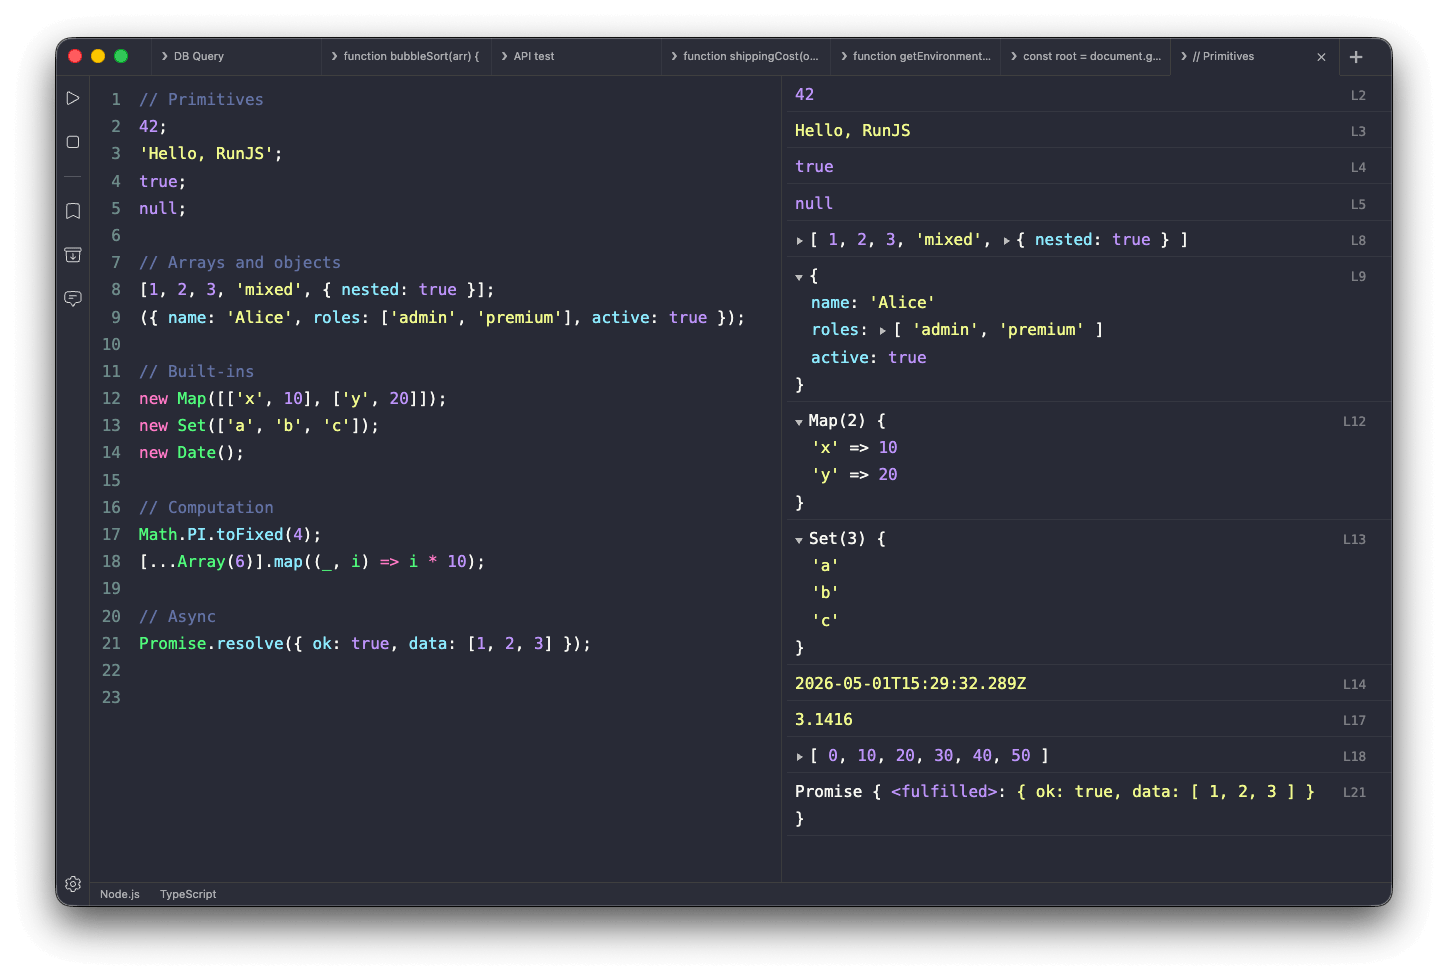
The output pane sits opposite the editor and shows the results of each run. It updates in place every time your code executes, so you don't need to scroll through a growing log to find the latest result.
Where output comes from
Three things produce output:
console calls — Anything written through console.log, console.info, console.warn, console.error, console.table, and so on appears in the output pane, with warnings and errors styled differently from regular logs.
Top-level expression results — When Auto Log is enabled in Settings → General, the value of each top-level expression is displayed in the output pane. This is what makes RunJS feel like a REPL: you can type 1 + 2 on its own line and see 3 appear without writing console.log.
Errors — Uncaught exceptions and unhandled promise rejections are surfaced with the message and stack trace, pinpointing the line where the error originated.
Inspecting values
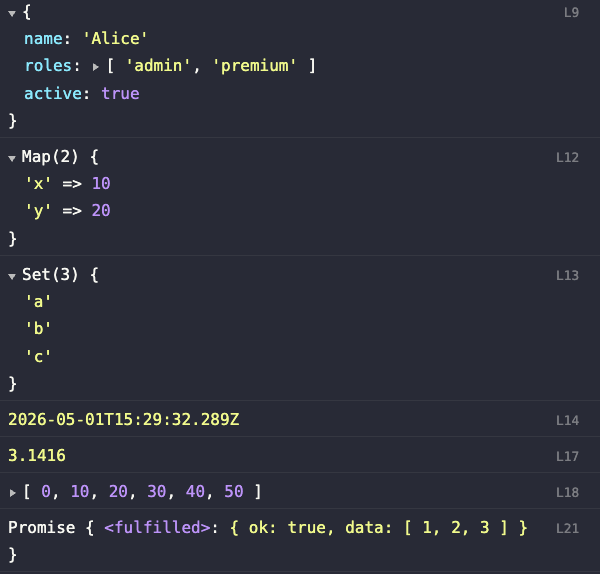
Objects, arrays, Maps, Sets, and other complex values are shown as expandable trees. Click to drill into nested properties, or expand everything to scan an entire structure at once. Functions, classes, and Promises are rendered with enough detail to identify them without expanding.
Strings are displayed verbatim — quotes are only added when a string is nested inside another value, so you can read a logged string the way you'd read it in a terminal.
Tracing output back to source
Each output entry is tied to the line of code that produced it. RunJS makes this connection visible in two ways:
- Hovering over an entry highlights the corresponding line in the editor, so you can scan output and see where each value came from without leaving the mouse.
- Each entry displays its source line number on the right. Clicking it moves the editor caret to that line, which is the fastest way to jump back to the code behind a given result — particularly useful in longer scripts.
Entry actions
Each entry has a three-dot menu on the right with two actions:
- Copy — copies the value to the clipboard.
- Explain Result — opens the AI Chat sidebar and asks the configured model to explain why the surrounding code produced this result. Handy when something is unexpected and you'd rather have the assistant trace through it than reason about it yourself.

Web view
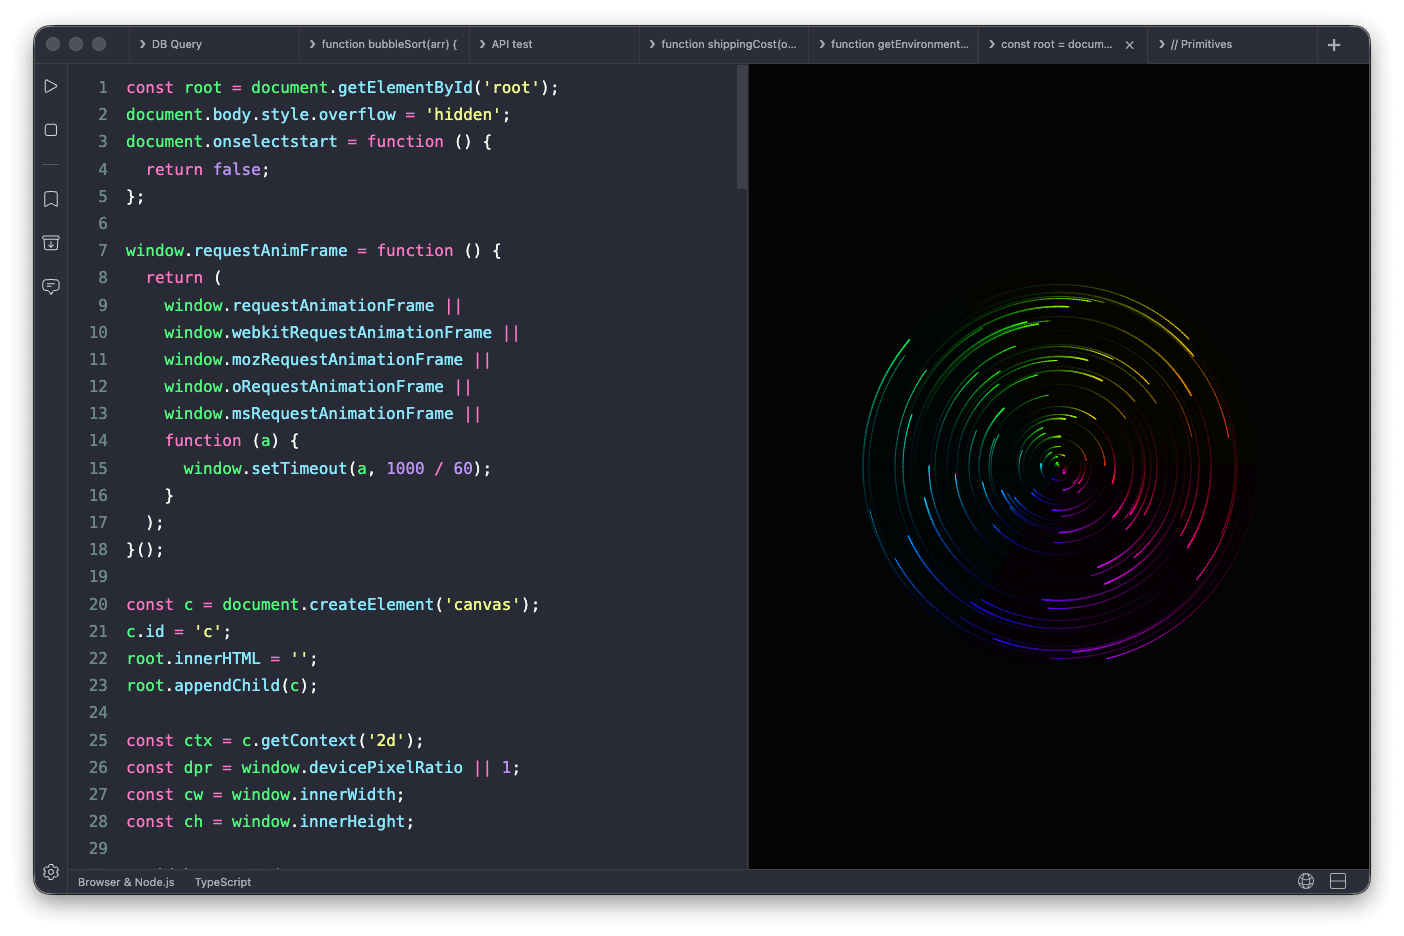
The output pane can also display a web view, which renders the HTML and DOM produced by your code instead of showing a structured log. Toggle it via the web view button in the status bar.
The web view is only available when the tab is using the Browser & Node.js or Browser runtime environment. Tabs running under the Node.js environment have no DOM to render, so the toggle is hidden.
Related features
- Logpoints — log a value without modifying your source code.
- Magic Comments — annotate your code to control how individual lines or blocks are evaluated and displayed.